Chart Ninja Education: beginner lessons built to make the market feel less overwhelming
Education Menu

Learn Trading Without The Usual Mess.

This page is designed as a clean starting point for beginners. We go from the most basic question, what trading is, into platforms, long and short, lots, support and resistance, sessions, timeframes, and risk. Compact enough to read fast, solid enough to actually understand.

8 Core lessons ordered from beginner topics to practical chart concepts.
Fast Compact explanations that still give enough depth to be useful.
Clear Written for people who want less jargon and more actual understanding.
What Is Trading? CFDs, Brokers & Exchanges Long & Short Lots & Position Size Support & Resistance Sessions Timeframes Risk Management
01

Most beginners jump straight to indicators, signals, and entries. The better route is to first understand the market language. Once that clicks, every chart starts to feel less random.

Build the base before you chase setups.

Read the first four topics in order if you are new. They explain what trading is, where trading happens, what long and short mean, and how size changes risk. After that, move into the chart-reading topics so support, resistance, sessions, and timeframes start to connect properly.

Understand the market first

These first lessons explain the basic mechanics. If these are fuzzy, everything else ends up feeling more confusing than it needs to be.

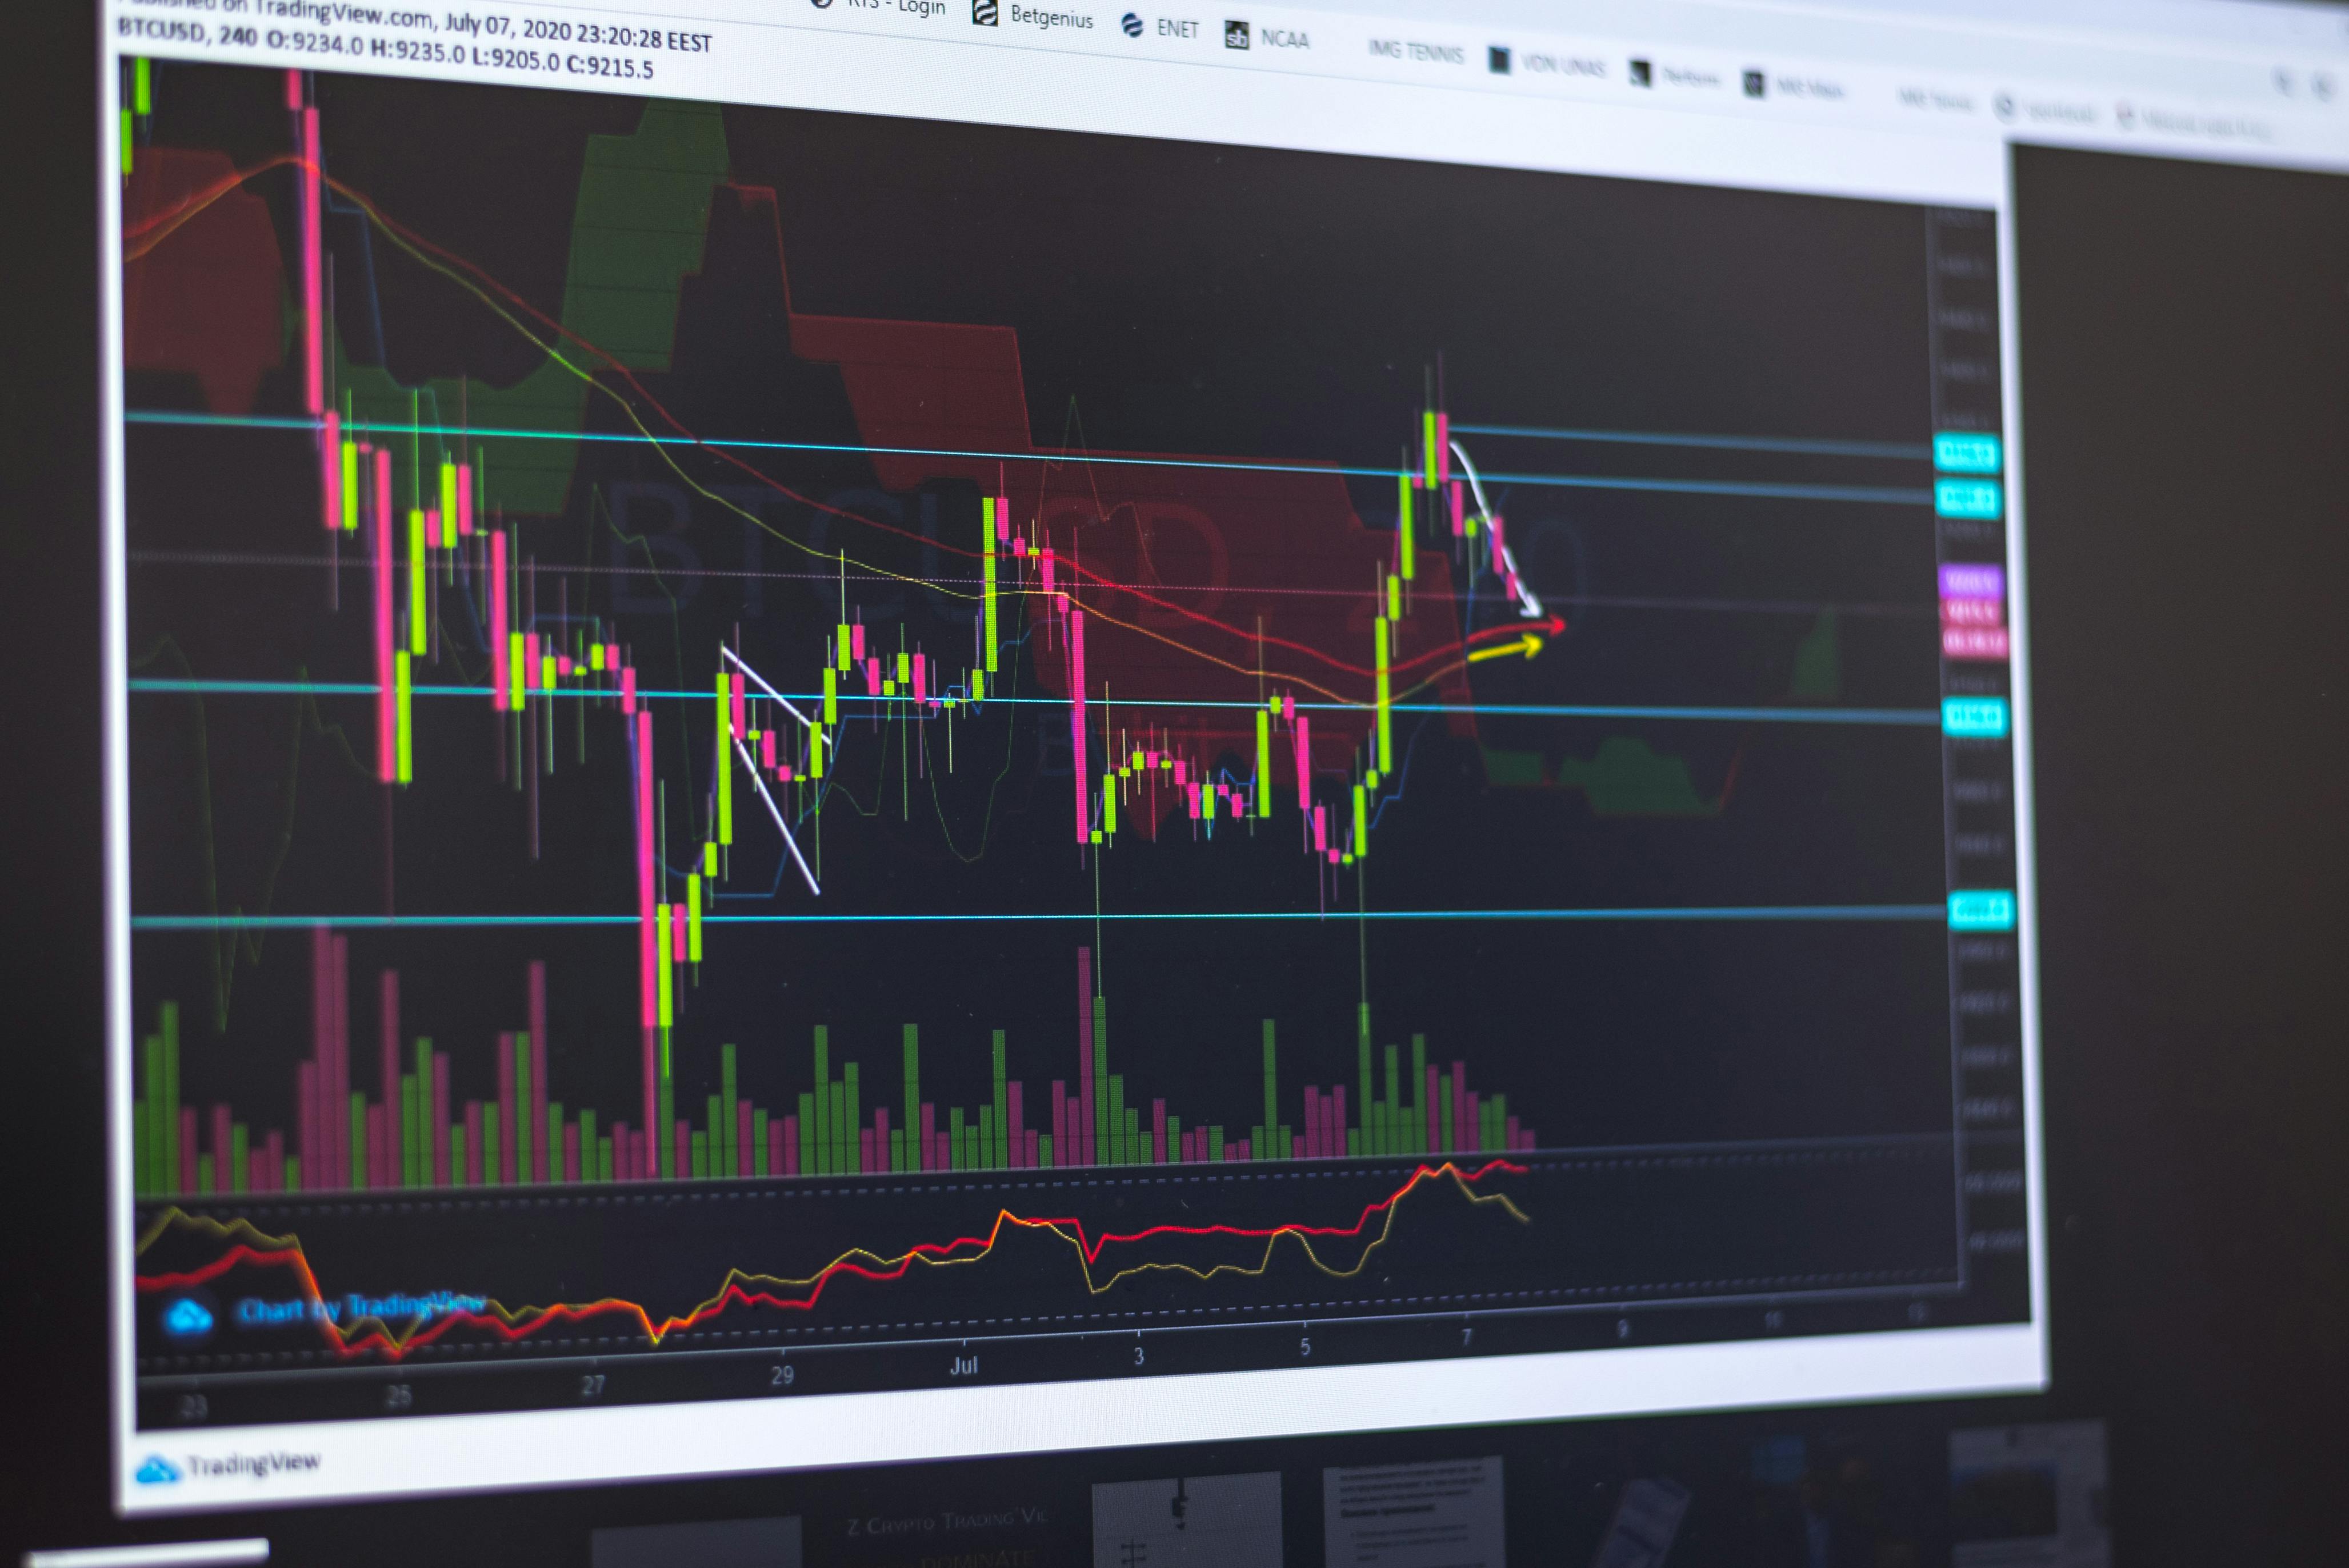
Trading chart on a monitor

What Is Trading?

Trading means trying to profit from price movement. You buy because you expect a move up, or you sell because you expect a move down. The thing being traded can be forex, indices, stocks, crypto, gold, or another market.

The difference from investing is mostly about timing and intent. Investors often hold for months or years. Traders usually focus more on entries, exits, structure, volatility, and shorter-term movement.

  • Price movement is the main thing a trader studies.
  • Charts are the visual language of buyers and sellers.
  • Good trading is structured decision-making, not random guessing.
Simple Example If Bitcoin is at 100 and you buy because you think it can reach 110, you are trading the move rather than simply “believing in” Bitcoin.
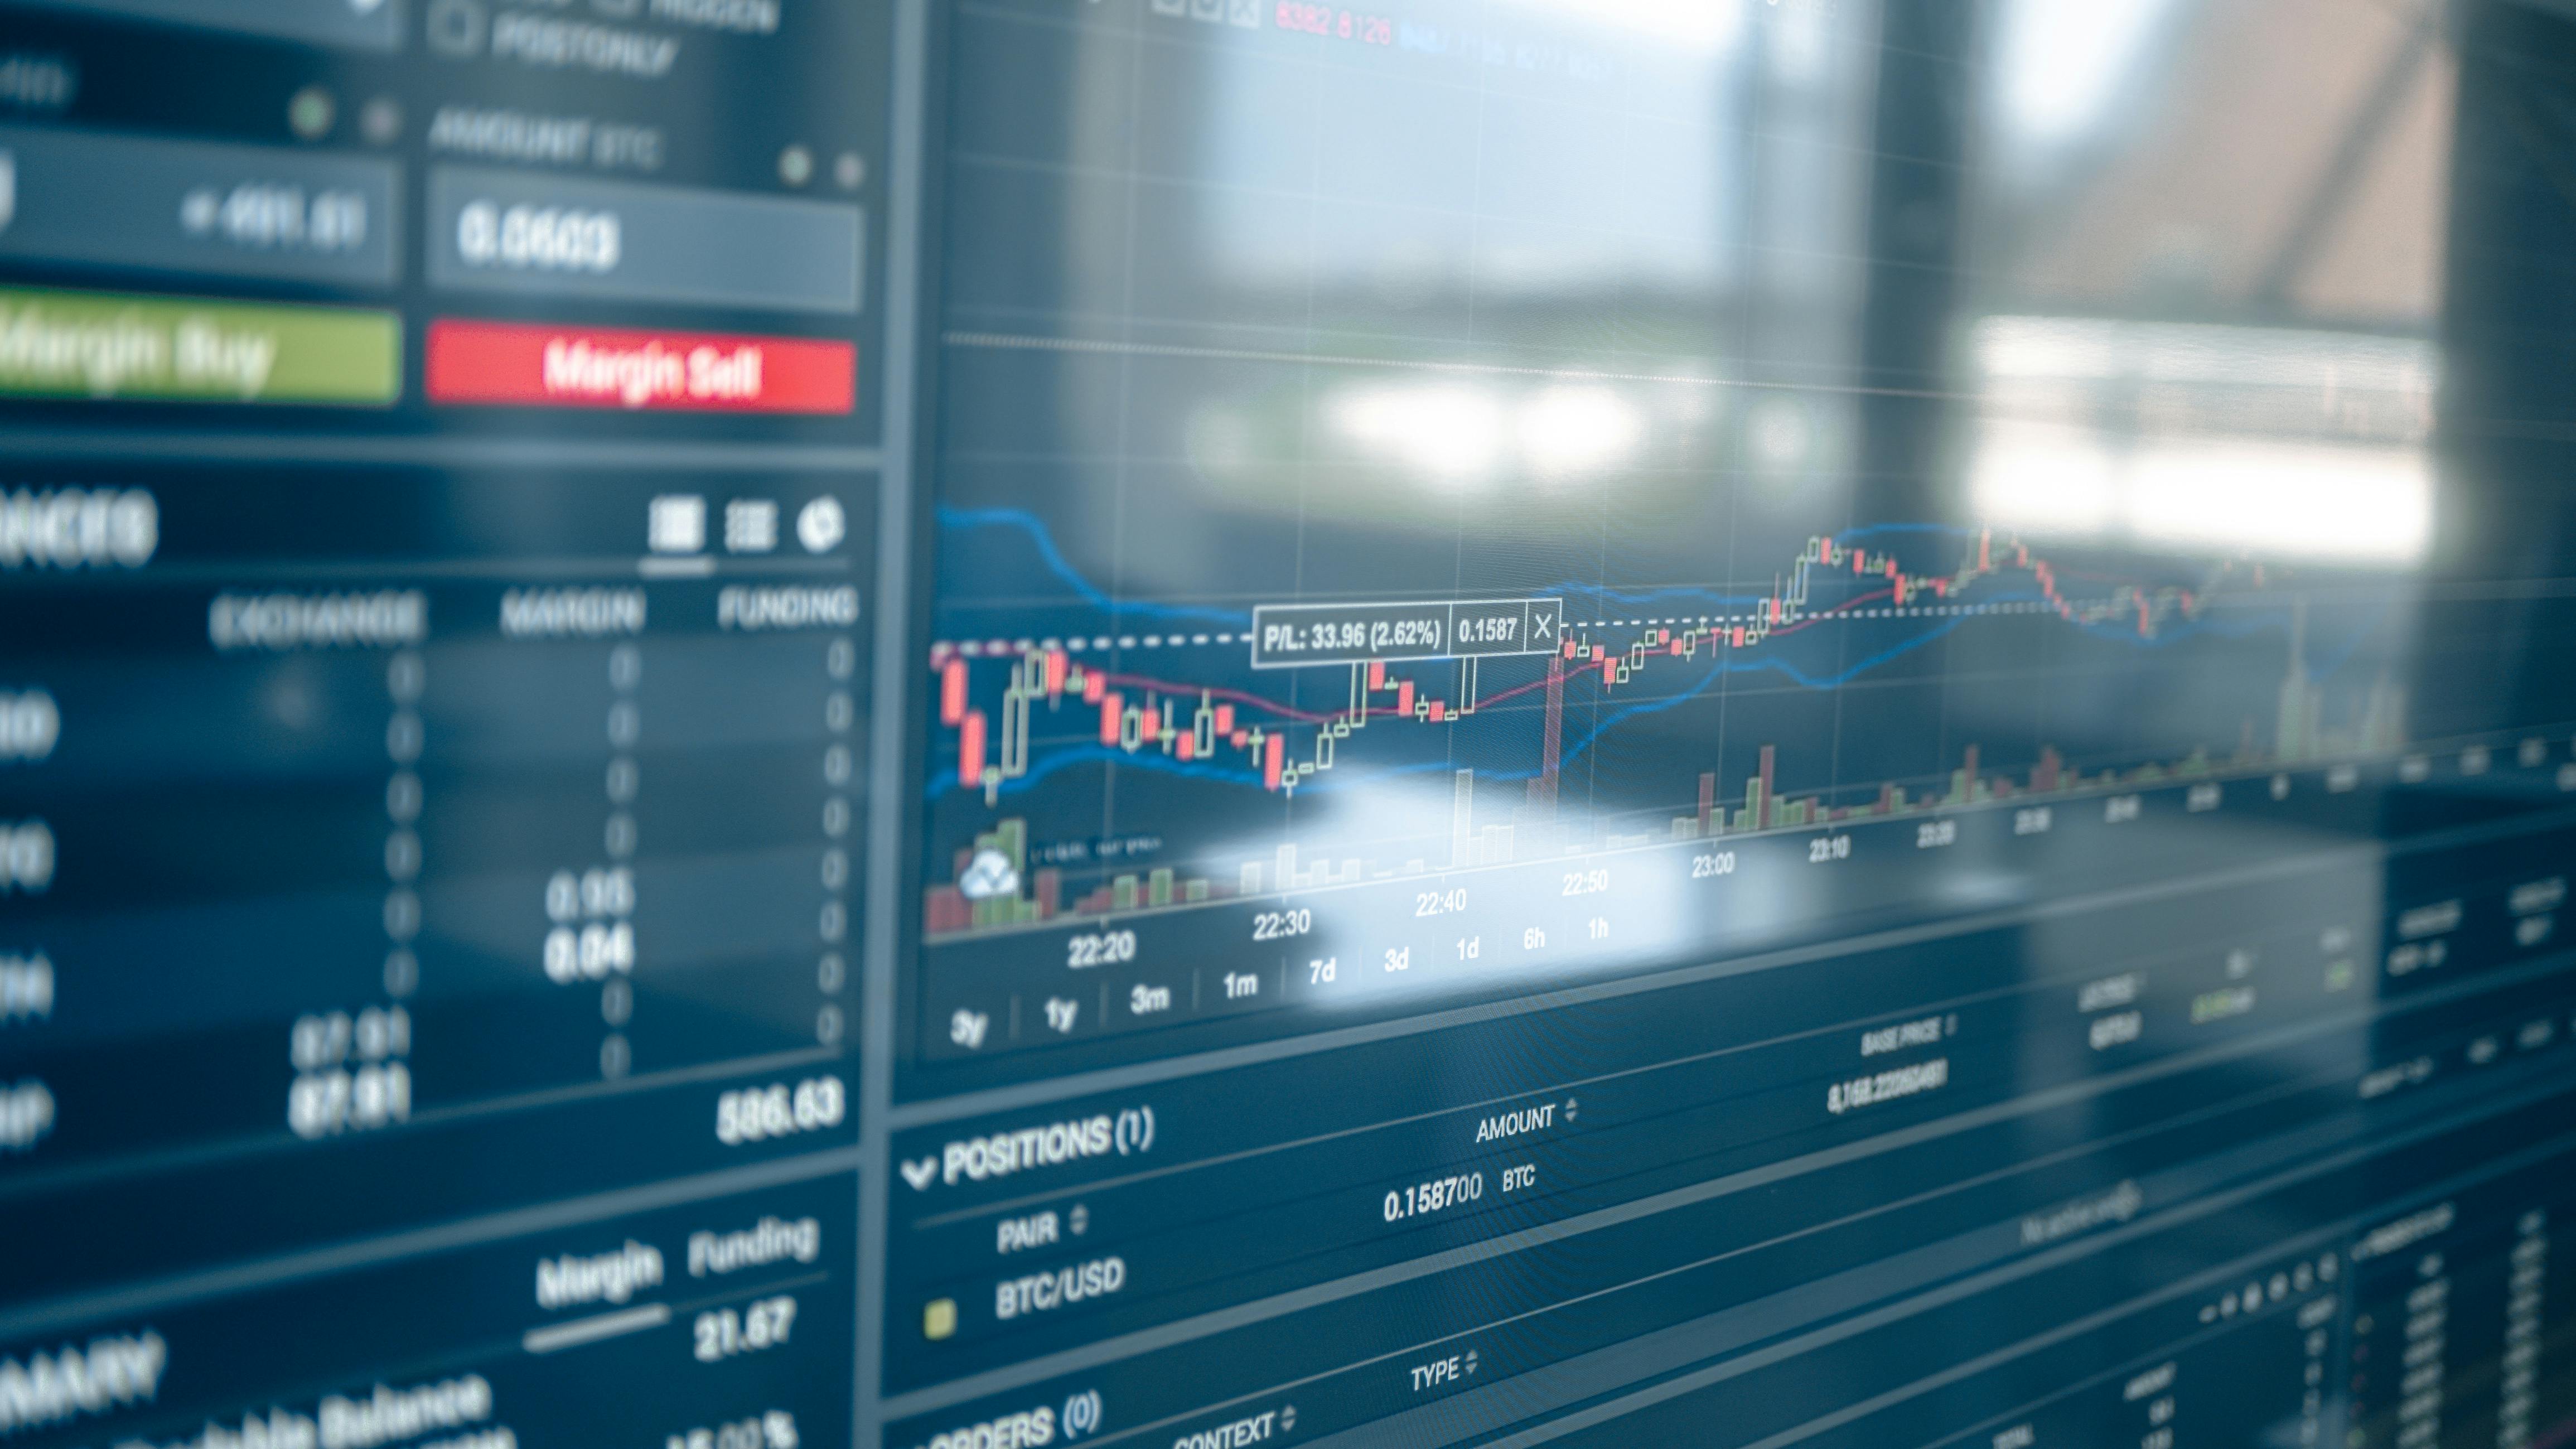
Crypto trading interface on a screen

CFDs, Brokers, and Crypto Exchanges

A broker is the platform or company that gives you access to a market. With CFD trading, you usually do not own the actual asset. You are speculating on the price movement through a contract instead.

A crypto exchange is different. On spot markets you often buy and sell the actual coin or token itself, although many exchanges also offer futures or leveraged products that behave more like derivatives.

  • CFD means you trade the price movement through a contract.
  • Brokers are common for forex, indices, and commodities.
  • Crypto exchanges are where digital assets are bought and sold directly.
Rule Of Thumb Forex and indices often go through brokers. Spot crypto usually goes through exchanges. Always check fees, leverage rules, and whether you own the underlying asset.
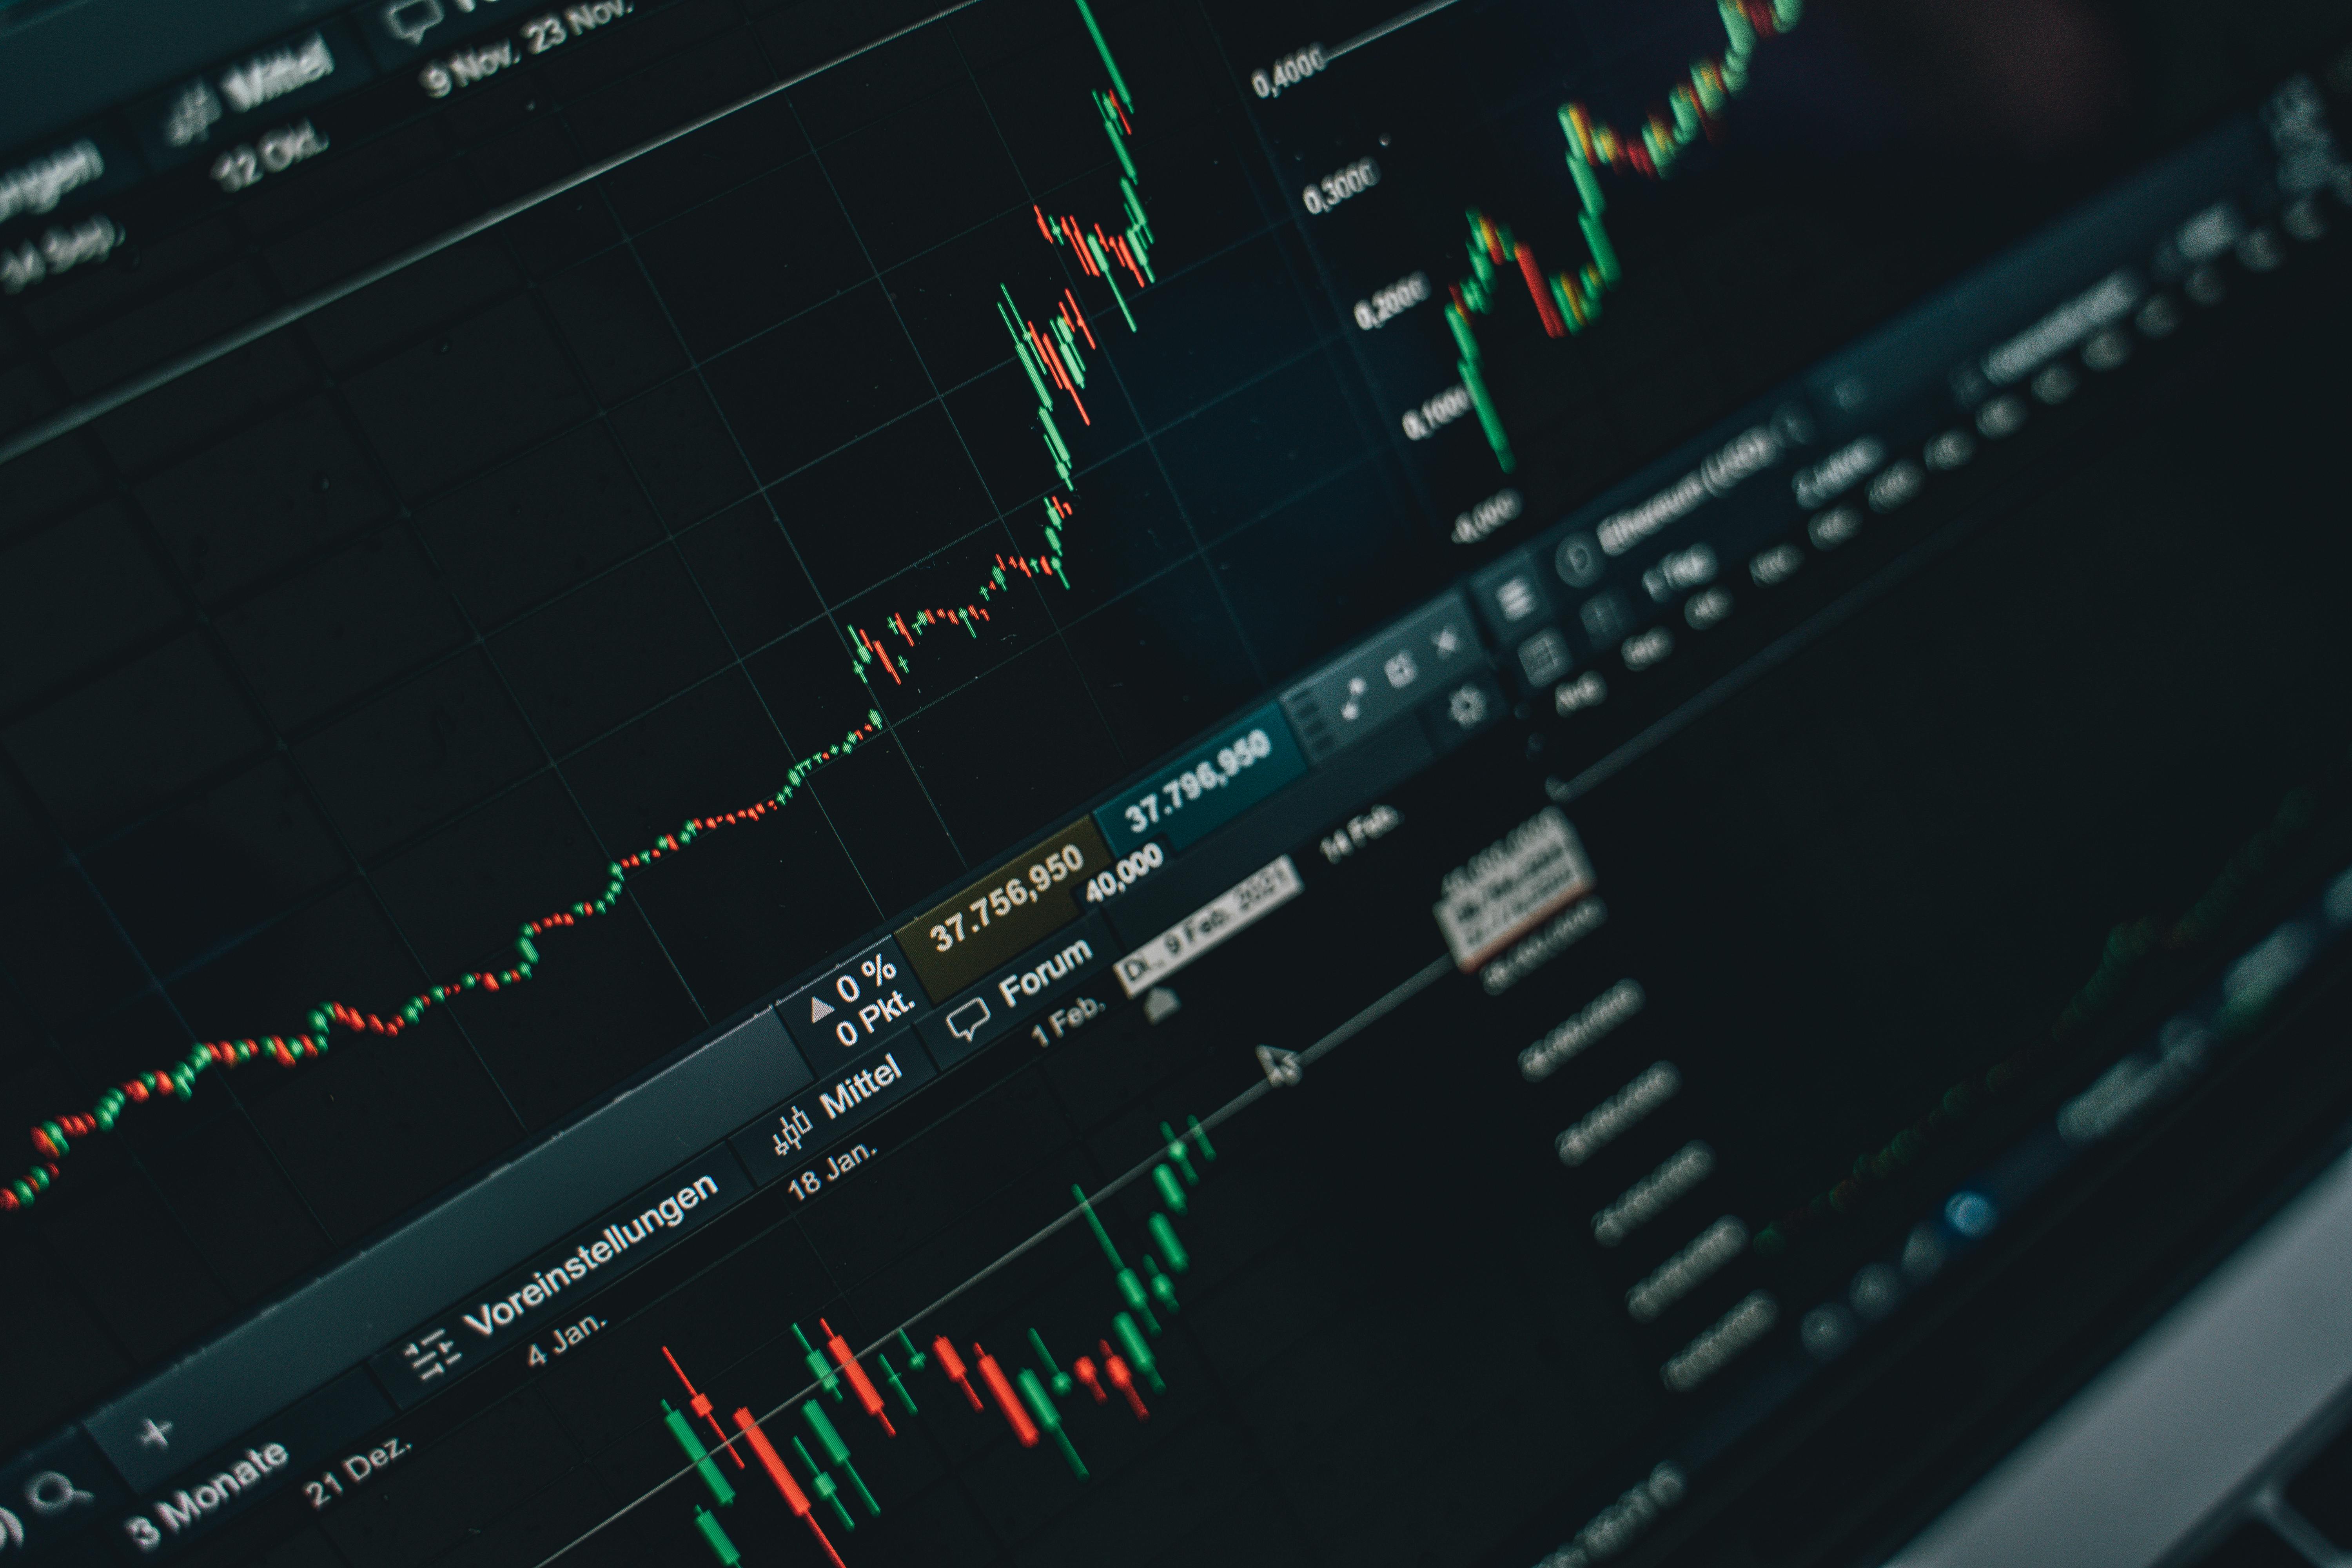
Bearish chart on a screen

What Is Long and What Is Short?

Going long means you expect price to rise. You buy first and hope to sell later at a higher price. Going short means you expect price to fall. You sell first and aim to buy back lower.

A lot of beginners only think in terms of buying, but many trading platforms also let you profit from downward moves. That matters because markets do not only trend upward.

  • Long = bullish idea.
  • Short = bearish idea.
  • Your direction should always match where your stop and target make sense.
Quick Example If EUR/USD is 1.1000 and you think it will rise, that is a long idea. If you think it will drop to 1.0950, that is a short idea.
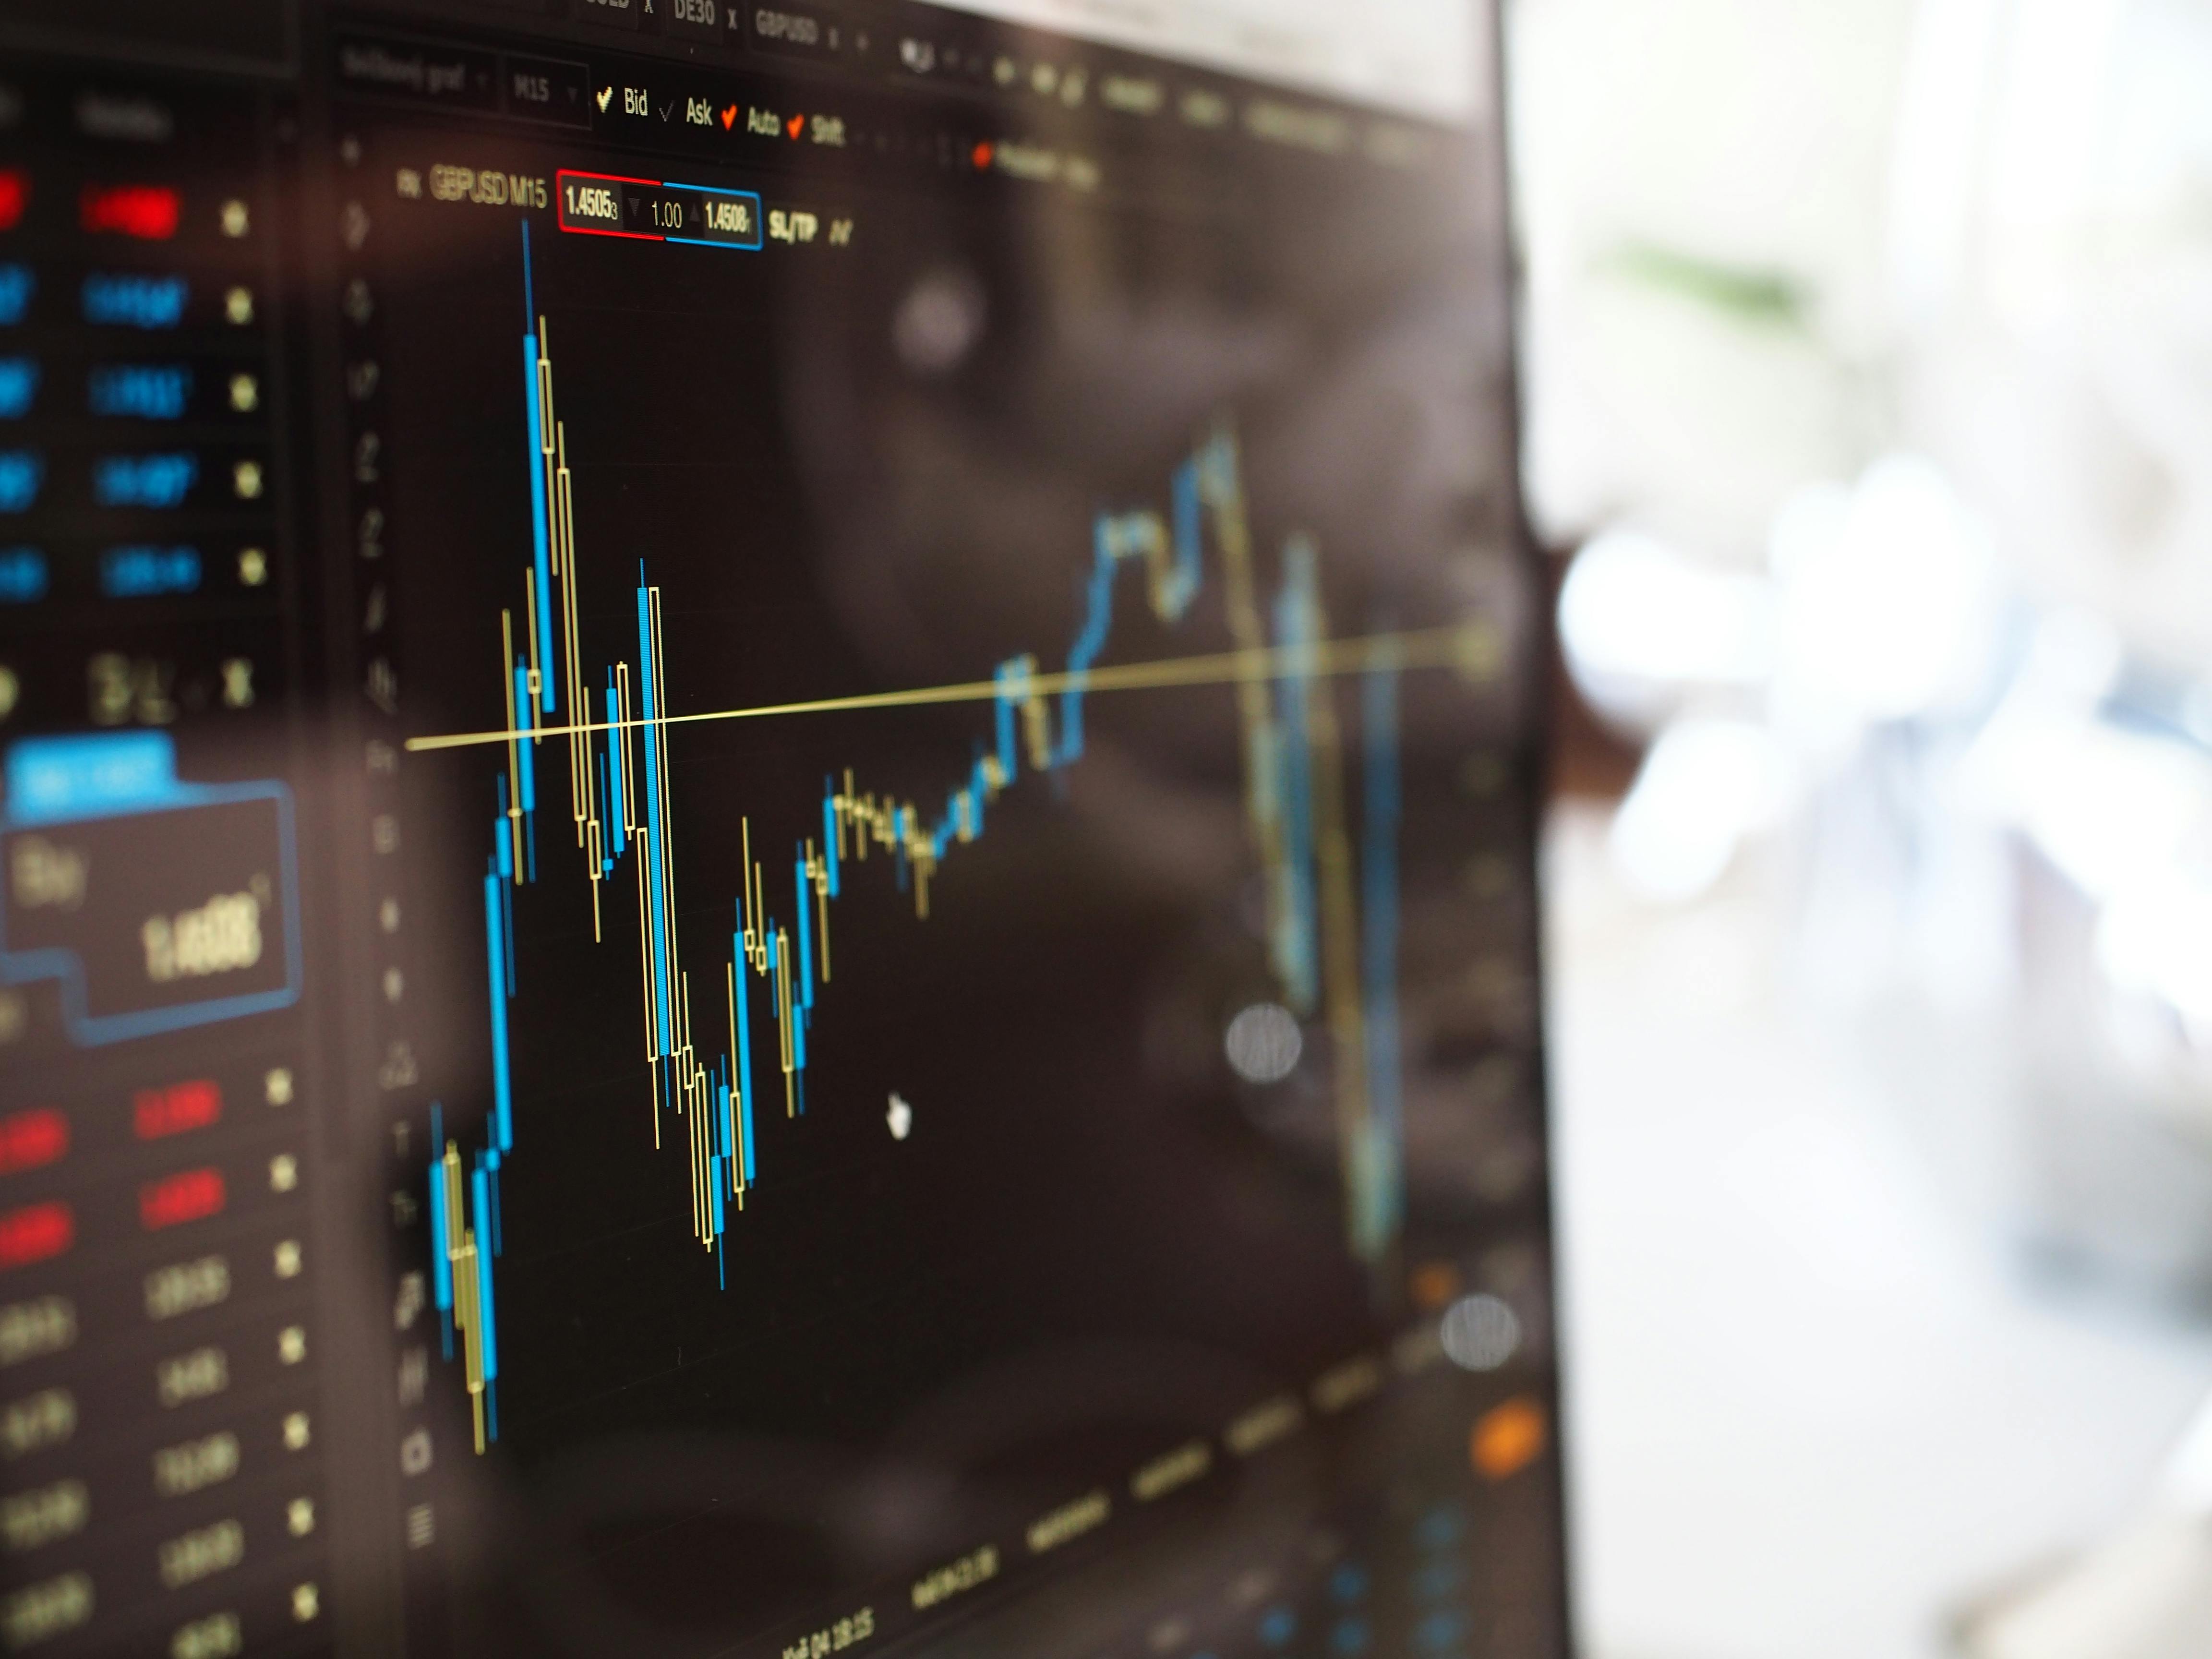
Order book and pricing ladder

What Are Lots and Position Size?

A lot is a standard way to describe trade size, especially in forex. A standard lot is bigger, a mini lot is smaller, and a micro lot is smaller again. The exact value depends on the market, but the principle is always the same: more size means more risk.

Even a strong setup becomes dangerous when the position is too large. Skilled traders often decide how much money they are willing to lose first, then calculate size from that number.

  • Bigger size increases both potential profit and potential loss.
  • Your account size should guide your position size, not your emotions.
  • A stop loss without correct sizing can still be far too risky.
Practical Idea If you only want to risk 1 percent on a trade, your position size should be adjusted so that the stop loss matches that amount.

Make the chart feel less random

These concepts help you understand where price often reacts, when movement usually expands, and how the same market can look totally different depending on the timeframe you use.

Trading screen with support and resistance lines

What Is Support and Resistance?

Support is an area where price often finds buyers and reacts upward. Resistance is an area where price often finds sellers and reacts downward. These are usually zones, not perfect single lines.

Support and resistance matter because markets remember important areas. Traders watch these zones for bounces, breakouts, rejections, and retests.

  • Support usually sits below current price and may slow a drop.
  • Resistance usually sits above current price and may slow a rise.
  • The cleanest levels often work best when they align with trend and timing.
Trader Tip If price breaks resistance strongly and later comes back, that old resistance can sometimes act as new support.
Market chart with visible session momentum

What Are Market Sessions?

Sessions are the major trading windows during the day. The main ones traders talk about are the Asian session, London session, and New York session. Each one has its own rhythm and level of volatility.

Forex traders care a lot about sessions because the market often becomes much more active when the large financial centers open. The overlap between London and New York is often one of the liveliest periods.

  • Asian session is often slower and tighter.
  • London often brings momentum and expansion.
  • New York can continue the move or completely shift it depending on liquidity and news.
Why It Matters A breakout during a dead session may fail differently from a breakout during the London open. Timing changes setup quality.
Chart on a broader timeframe

Timeframes and Trading Styles

A timeframe tells you how much information each candle contains. On a 5-minute chart, one candle represents 5 minutes. On a 1-hour chart, one candle represents 1 hour. The same market can look chaotic on one timeframe and very clean on another.

Scalpers usually focus on very low timeframes. Day traders often work intraday. Swing traders rely more on higher timeframes like 4H and Daily because the structure is often easier to read.

  • Lower timeframe means more noise and faster decisions.
  • Higher timeframe usually means fewer but cleaner signals.
  • Many traders use higher timeframe bias and lower timeframe entry.
Easy Framework Use the higher timeframe to decide direction, then use the lower timeframe to time the actual entry.
Detailed market data and watchlists

Risk Management, Stops, and Leverage

Risk management is what keeps you in the game long enough to improve. It means deciding in advance how much you can lose, where your idea is wrong, and whether the possible reward is worth the risk.

Leverage can make a position feel more powerful, but it also makes mistakes more expensive. A stop loss defines where the trade ends if the idea fails. Strong traders protect downside first and hunt profits second.

  • Always know your invalidation before entering.
  • Too much leverage with weak discipline destroys accounts quickly.
  • A simple 1:2 risk-reward structure already gives you breathing room.
Healthy Habit If you risk 1 unit to make 2 units, you do not need to win every trade to grow over time.

Buy The Full Trading Course

Ready to go beyond the basics? This course pulls the core concepts together into one structured path so beginners can build a cleaner understanding of charts, timing, entries, risk, and execution.

$59.99 $29.99 Sale
Buy Full Trading Course